Modernising data analysis: knowing your customers’ needs
- Like
- Digg
- Del
- Tumblr
- VKontakte
- Buffer
- Love This
- Odnoklassniki
- Meneame
- Blogger
- Amazon
- Yahoo Mail
- Gmail
- AOL
- Newsvine
- HackerNews
- Evernote
- MySpace
- Mail.ru
- Viadeo
- Line
- Comments
- Yummly
- SMS
- Viber
- Telegram
- Subscribe
- Skype
- Facebook Messenger
- Kakao
- LiveJournal
- Yammer
- Edgar
- Fintel
- Mix
- Instapaper
- Copy Link
Posted: 16 December 2019 | Thomas Kritzer - Wiener Linien | No comments yet
For a long time in public transport, it was enough to have experienced staff who knew their business and their customers’ needs, but today there are considerably more elements to consider. Thomas Kritzer, Head of Tramway Operations Division at Wiener Linien, explores how refined data analysis can lead to a more seamless transport system, and in turn, a better customer experience.
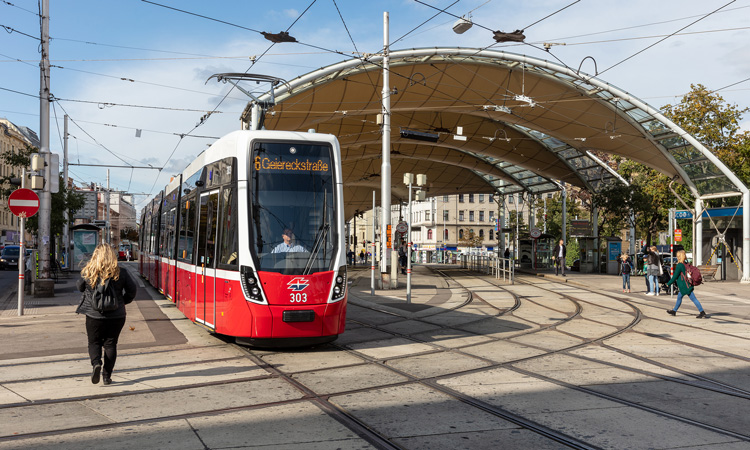
The Viennese tram network – developed over more than 100 years and with a network stretching over 28+1 lines – is an important backbone in the city’s public transport system. In light of the evolution of data science, it is clear that developments in and reflections from data analytics can also have an impact on operating a tram system in a stable and continuous manner.
Systems and data landscape
Operational IT systems, those on vehicles or those that are part of the infrastructure, have a very long lifespan, and were largely not built with data collection or analysis in mind. Terms like ‘data warehouse’ and ‘business intelligence’ did not exist at the time and, as a result, public service companies with limited resources face a difficult path to achieve data insights from such systems. The basic questions are: where is the data, what can we get out of it, and what do we really need?
Why should we use data analytics?
The approach at Wiener Linien’s tramway operations division is to make better decisions. Data analysis is never an analysis for the sake of it, there must be a clear benefit. One of the most important factors for success in an enduring organisation like Wiener Linien is its people and their expertise. However, where staff expertise was once enough to base decisions on, times have changed and the time for guessing is officially over.
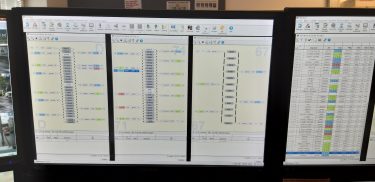
Data processed to control daily operations in a control room working place
Today, decisions are more complex – you need to consider more influences, and the number of long-time experts in the industry is decreasing. As a result, we need a new basis for decision making and, as in many other businesses, these decisions must be based on facts. Public transport now has the chance to open the decision-making process to data-based facts, supported by machines, under more complex circumstances. Data analysis can be tailor made and dynamic to fit an organisation’s needs.
The hidden data ocean
The relevant data sources are ‘inside’ our operational IT systems – the challenge has been getting them out! Which systems do we use? For operations, there is the ITCS system – the IT system for documenting incidents and all kinds of disturbances. There is also the systems for staff shift planning and planning operational schedules.
As an example, the ITCS system controls and supports disposition work in our control rooms and is the source of relevant data to analyse our punctuality and regularity. The data is collected between trains via intercommunication and so called ‘bakken’ to register the trains at specific locations. Some of this data is used in the control room working places.
The evolution of IT systems and their increasingly modern performance helps to provide us with better analysis, more dynamic inquiries and more specific, tailor-made reports for specific problems
Every single data set on a tram stopping, such as its location and ‘time stamp’, exists in the system, but needs to be translated into a usable format for analytics. It then has to be sent via interfaces in an analysis system, data warehouse or business intelligence tool. Algorithms therefore need to be developed and applied, rendering the data as readable statistics.
What do you want to know?
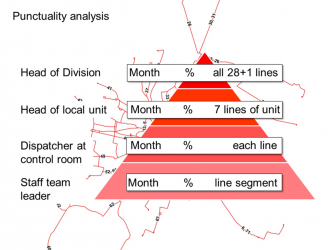
Defining use cases for punctuality statistics
The tramway operations division in Vienna operates over 400 trains in peak hours – a network that produces tens of thousands of data sets per hour. It’s at this point that you need to have a clear idea of what you want to find out from your data. For example, when analysing punctuality, which is a huge quality factor for our customers, we are able to use the data set of each train at every stop on the network. We need to develop routines that give us a good data basis containing the right amount of data sets, whilst ensuring that number is manageable so that our IT performance does not overrun.
Defining analysis targets
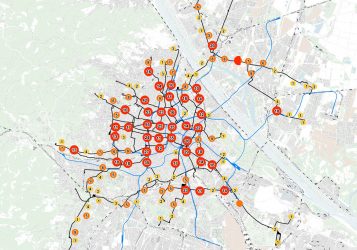
Example of visualisation of incidents of Wiener Linien
The tramway operations department orientates on EN 13816 – a standard which a lot of public transport operators in Europe are connected to. It gives advice on measuring the quality of operations and these key performance indicators need to be drawn from data analysis of the operational systems. Here we have our first target: we need to know our performance indicators in order to reflect on the quality of our service.
The evolution of IT systems and their increasingly modern performance helps to provide us with better analysis, more dynamic inquiries and more specific, tailor-made reports for specific problems. The data is not only used for ‘static’ reports, but for dynamic analysis on specific lines or incidents.
In such analysis development and usability reflection, different people in different job functions need different statistics as a result. As the head of division needs a more general report, local heads of units or dispatchers in the control rooms need more dynamic reports of specific lines or segments. As such, defining its target audience is vital for developing a useful output instead of a data graveyard.
Benefit for the customer
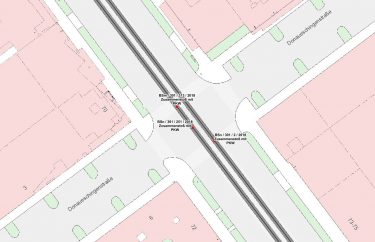
: Detailed analysis picture with location and incident file numbers
It is very important for an operator to know their business. We can look at parts of our system and work out where we need to improve and learn from our (now more visible) shortfalls.
As part of a continuing improvement process, we can more effectively check if measures work and if we really improve. Due to better IT performance, key performance indicators such as punctuality, regularity or availability of service are now more measurable than years ago.
Using data: reducing the number of incidents
One of the first data analytics procedures supported the target of reducing incidents. The analysis process moved to a more data-based analysis, as we could fix the incident locations with GPS data. We visualise it exactly on a network map with an interface sending the data from the incident documentation to the visualisation.
In connected processes, we need to make our service the best possible quality, for example, by thinking of the influence of infrastructure on the quality of operation
It is possible to break down these statistics to specific incident hot spots, as they are connected to localisation via GPS data. The points of conflict are visualised and create a so-called ‘hotspot landscape’ for further use. These visualisations are used to improve urban infrastructure, like traffic light coordination, road signage or crossway layout, and help in building more awareness of the drivers. This helps to make tramway operation safer, for both the driver and the customer. Using this analysis, the number of collision incidents fell by 40 per cent between 2010 and 2018.
Better correlation proof
One part of the evolution is to move towards more scientific work. This makes it possible for us to better build a hypothesis on complex questions – and start analysing if they are provable or not. This is even more important in the increasingly complex world of delivering world-class public transport services.
In connected processes, we need to make our service the best possible quality, for example, by thinking of the influence of infrastructure on the quality of operation.
With advanced data analysis, it is possible to analyse how many additional seconds are needed for a tram to cross a construction site and its impact on our three-minute peak hour tram headway. This information is important because we want to make better decisions when planning construction sites to guarantee excellent service for our customers. It then becomes possible to adjust our plans, perhaps shifting the renewal to a less dense operational period or adapting the traffic light circulation.
We want to make better decisions when planning construction sites to guarantee excellent service for our customers
There are huge benefits to using data analytics to gain a more in-depth view of internal processes, as there are a number of necessary processes the tram undergoes before it leaves the depot to go into service. This includes maintenance procedures on the infrastructure and vehicle side, and ensuring it is technically prepared. Operational back-office procedures like staff rosters or staff preparation and training are needed, and advanced monitoring paves the way for improvement. There is no ‘one solution’ for all the challenges, but a lot of small improvements lead to overall better performance. This is ultimately crucial for providing good service at the end point – to the customer.
Biography
Thomas Kritzer joined Wiener Linien in 2004 and is Head of the Tramway Operations Division. With this division, he is responsible for managing operations on 28 tram lines with about 1,500 staff members, carrying almost a million passengers per day. The division plans and prepares Wiener Linien’s tramway operation, as well as being in charge of operational duties, documentation and evaluation of service quality. Responsibilities also include strategic development of the division and mode and, together with other departments, further development of tram lines and the future of mobility at Wiener Linien.
Related topics
Intelligent Transport Systems (ITS), Passenger Experience, Public Transport, Travel & Passenger Information
Issue
Issue 4 2019
Related modes
Trams
Related organisations
Wiener Linien