The automation of metros: a proven and scalable solution
- Like
- Digg
- Del
- Tumblr
- VKontakte
- Buffer
- Love This
- Odnoklassniki
- Meneame
- Blogger
- Amazon
- Yahoo Mail
- Gmail
- AOL
- Newsvine
- HackerNews
- Evernote
- MySpace
- Mail.ru
- Viadeo
- Line
- Comments
- Yummly
- SMS
- Viber
- Telegram
- Subscribe
- Skype
- Facebook Messenger
- Kakao
- LiveJournal
- Yammer
- Edgar
- Fintel
- Mix
- Instapaper
- Copy Link
Posted: 16 February 2014 | Miryam Hernández | No comments yet
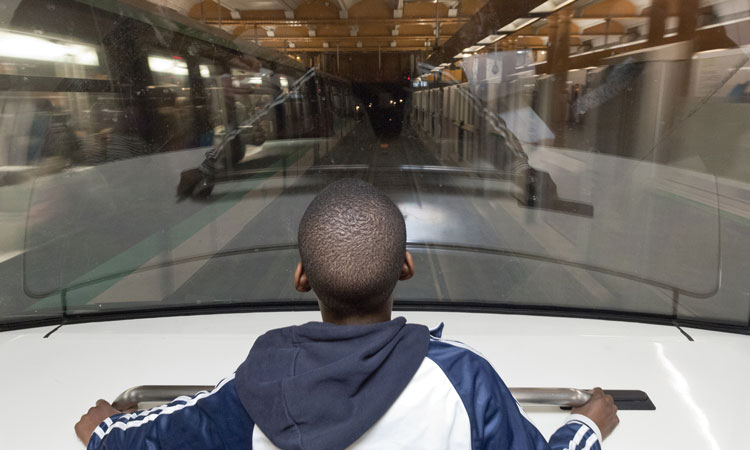
The UITP Observatory of Automated Metros1 recently released the 2013 edition of its Atlas of automated metros – a detailed overview of the metro automation landscape and an analysis of future trends. This article presents a selection of the Atlas data, with a focus on technical trends.
In September 2013, when the new ‘Atlas of Automated Metros’ was published, there were 674km of automated metro in operation, in 48 lines that together served 700 stations in 32 cities.
These figures are for Unattended Train Operation (UTO) systems that provide a public transport service and have a minimum capacity of 100 passengers per train2. There are also lines that were designed as UTO lines but which currently do not operate as such, and are therefore not included in the Atlas.
In the 12 months before the publication of the report, four new lines joined the UTO club. Two in South Korea – U Line (in Uijeongbu) and Everline (Yongin) – and two in Italy – Milan Line 5 and Brescia Line 1.
Europe and Asia are the continents with the largest number of kilometres of automated lines. However, automation is present worldwide. While France leads at country level, it is significant to note that the three longest automated networks – Dubai, Vancouver and Singapore – are not in Europe. The four top countries in number of kilometres belong to four different continents. Behind France, we find Korea, the United Arab Emirates and Canada.
Train capacity
There has been a significant evolution from mostly low capacity trains (<300 passengers) in the pioneering lines to the recent incorporation of high capacity trains (>700 passengers). Currently, about half of lines run mid-capacity trains (300-700 passengers).
The last five years show a clear increase in mid-capacity trains, whereas small and high capacity trains follow a slower, but parallel progression, demonstrating that UTO continues to be employed to respond to very different mobility needs.
It is worth noting that one of the main advantages of a UTO line is its capacity to offer increased frequencies. This allows the use of smaller trains running at higher frequencies, instead of larger trains at longer headways. For passengers, this translates to a better level of service for the same capacity.
Line length and number of stations
A more detailed analysis at line level illustrates the wide range of situations and solutions covered by automated lines; be it in length, in number or density of stations.
Some of the longest metro lines in the world are actually automated, contradicting a past assumption that automation was best suited for short lines. Lines range from 52km (the Dubai Red Line) to 3.5km (the Hong Kong Disney Resort Line). The average sits at 15km – a common value for conventional metro lines, particularly underground.
The longest lines are not necessarily the ones with the largest number of stations. For example, Dubai’s 52km-long Red Line has 27 stations, while Lille’s Line 2 is 31km-long and has 44 stations.
Constructive models
This diversity of line typology is confirmed by the remarkably even significance of underground and elevated stations; although the number of exclusively underground lines is low, compared to that of fully elevated or mixed lines.
In terms of constructive models, an analysis of the trend confirms the current picture, with practically equal growth levels on both elevated and underground kilometres. However, considering information for projects not yet in operation, the Observatory foresees a future increase in the share of elevated lines.
A line’s constructive model has a significant impact in many factors; in the case of UTO, it is particularly relevant to consider passenger evacuation procedures, especially in tunnels.
Signalling and track protection
For signalling, inductive loop remains, in absolute terms, the leading technology in the last five years (considering the number of new kilometres in operation). However, analysis of the Observatory data for new projects not yet in operation shows a predominant trend for the use of free propagation radio-based CBTC systems in the near future.
Platform Screen Doors (PSDs) appear clearly as the predominant trend for track protection, leaving ground for a reflection on the opportunity for other detection technologies, considering the costs of PSDs and the growing market.
Conversions
Whereas current data depict a very low number of cases of conversions (Nuremberg in 2009 and Paris in 2012), the success of these complex projects has demonstrated the viability of this option, opening the ground for new conversions. The Observatory’s data for future projects point to strong growth in the years to come.
Growth rate to triple in next 10 years
The Observatory of Automated Metros gathers information on all new UTO projects, as well as extensions for current lines in operation, allowing it to offer a projection for growth in the number of kilometres for UTO systems in the coming years.
The Observatory data for new projects highlight a trend for exponential growth in metro automation: in the next 10 years, the growth rate for kilometres of fully automated lines is expected to triple that of the current decade, reaching over 1,800km by 2025.
Data shows that each decade doubles at least the growth rate in the previous one. In the future, this will increase, reaching 3.5 times the current growth rate.
Growth in all continents with Europe leading
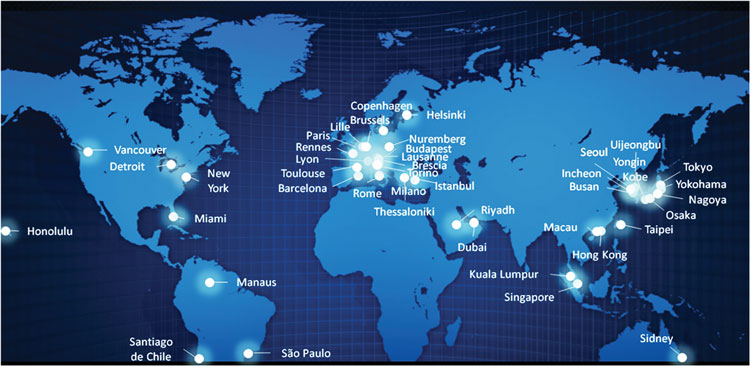
It is relevant to note that, geographically, between 2014 and 2025, Europe will lead in terms of growth. Asia and the Middle East will consolidate their strong presence in the UTO world, while South America, following the success of São Paulo, will continue to deploy automated lines. It is also significant to note that Australia will also join the UTO map.
The 2025 map of automated metro lines (see Figure below) clearly illustrates the global trend for automation and the dynamism of the sector.
Conclusions
The Observatory data presented in the Atlas of Automated Metros demonstrates that automated lines are:
- A proven solution – 30 years of experience from the implementation of the first lines, and with applications all over the world
- A scalable solution – data confirms that UTO is employed for very diverse lines in terms of length or train capacity
- An adaptable solution – their implementation in cities with very different mobility needs and demographic contexts demonstrate their adaptability.
It should be underlined that all the advantages offered by an automated line can be reaped only if a project is approached in a holistic way. It would be a mistake to approach a UTO project only from the technological angle. Other key aspects have to be taken into consideration, such as organisation and, of course, customer orientation. This can be summarised by saying that UTO requires a redefinition of the organisation model.
Reference
- metroautomation.org
- The Atlas criteria, as defined by the Observatory of Automated Metros.
The UITP Observatory of Automated Metros
The Observatory of Automated Metros is a UITP body composed of leading worldwide operators in this sector. In the context of global growth of UTO lines, the Observatory aims to be a reference body favouring the exchange of experience and dissemination of information on the advantages and applications of metro automation. It does this through the organisation of a regular seminar, through participation in conferences and through various publications.
The Observatory’s website1 includes information on its work, on the Atlas and a regularly updated world map of UTO systems.
Biography
Miryam Hernández joined the International Association for Public Transport in 2006 and is responsible for all metro activities within the Association, coordinating members’ work on the Metropolitan Railways Committee and Division, its five Technical Subcommittees and the Observatory of Automated Metros.
Related topics
Connected & Autonomous Vehicles, Multimodality, Public Transport, Sustainable Urban Transport, Traffic Management
Issue
Issue 1 2014
Related modes
Metro