How TfL uses ‘big data’ to plan transport services
- Like
- Digg
- Del
- Tumblr
- VKontakte
- Buffer
- Love This
- Odnoklassniki
- Meneame
- Blogger
- Amazon
- Yahoo Mail
- Gmail
- AOL
- Newsvine
- HackerNews
- Evernote
- MySpace
- Mail.ru
- Viadeo
- Line
- Comments
- Yummly
- SMS
- Viber
- Telegram
- Subscribe
- Skype
- Facebook Messenger
- Kakao
- LiveJournal
- Yammer
- Edgar
- Fintel
- Mix
- Instapaper
- Copy Link
Posted: 20 June 2016 | Lauren Sager Weinstein, Head of Analytics at Transport for London (TfL) | No comments yet
Lauren Sager Weinstein, Head of Analytics at Transport for London (TfL), has responsibility for the analysis of customer data, supporting operational and planning areas in delivery of services to TfL’s customers. London is a big growing city; more than 31 million journeys are made in the capital each day, 23% more than 15 years ago. Trains on one of the busiest underground lines, the Victoria line, carries thousands of commuters at a rate of one every 100 seconds during the morning peak. As Lauren explains for Intelligent Transport, it’s therefore natural that the data that TfL has access to is big as well…


Every day there are 20 million ‘taps’ captured through our ticketing system; our iBus location system provides accurate location and prediction information for all 9,200 vehicles in the fleet and we help keep London moving by managing traffic flow with our 6,000 traffic signals and 1,400 cameras. Our systems therefore record a vast amount of operational data.
However, just holding lots of data isn’t enough. To get value from it we have to turn it into useful information for our customers and into tools to plan and run our services. We actively experiment to see what we can learn from all data. The results of these trials allow us to improve the products and services that we deliver to our customers.
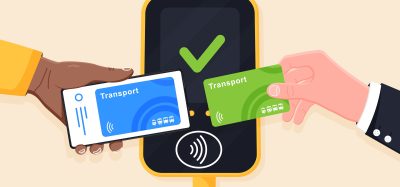
Using our ticketing data we have been able to build a comprehensive picture of travel patterns across our rail and bus networks. The use of Oyster and contactless payments through bank cards, Apple Pay and now Android Pay, has given us tube and rail station entry and exit data as customers have to touch in and out for their journeys. Bus journeys, on the other hand, may seem more problematic to monitor, as our customers are only required to tap in when they get on, but not when they exit. However, we can now tell when our customers are leaving a bus using a Big Data tool which looks at origin, destination and bus interchange information – which we call ODX. It combines bus location and ticketing data to try and match up origin and destination pairs to create a multi-modal travel dataset.
All of this information means that we can improve network and interchange planning and review the impacts of closures and diversions. For example, we used ODX to restructure the bus network in the New Addington area of London to help provide better services for local residents. In October 2015 we launched a new service pattern for the neighbourhood that better meets our customers’ needs.
Another example of how we have used big data to benefit customers was during a planned closure of the Victoria line in summer 2015, where works were taking place to allow an increased number of trains to run in the future. Our data allowed us to predict the impacts on the transport network and tailor our advice to customers, so that they were aware of how they would be affected in advance of making their journeys. It also meant that where their natural instincts would have led them to use bus routes or tube lines that were already popular, we could work out less obvious alternatives that would make their journeys more comfortable.
A valuable use of big data is in how it can be used to improve safety in London. We use big data to analyse trends from death and serious injury on the roads, which has allowed us to identify the major contributory factors and then better target preventative action. In 2015 the capital’s first interactive digital collision map was launched, which means anyone can now see where historic collisions have taken place in London dating back over 10 years. This tool has only been possible as a result of using big data and forms a key part of a continued drive to reduce the number of casualties on London’s roads.
As well as using our own data it is also important that we look further afield and collaborate with other organisations. We have taken part in a number of Hackathons – events where TfL data is shared with external parties to combine it with other data sets. We have an active programme working with universities and colleges to explore new ways of solving our transport challenges using data.
Going forward, we are now looking at innovative ways to utilise big data to provide more predictive travel information to greatly improve our operational management of the road network. To do this, data will be collected from our on-street sensors and cameras, combined with third party data sets and our extensive traffic models. By predicting pressure points, we hope to be able to help our customers and road users make informed decisions on their journeys and provide extra capacity on our current network.
In the next few years we will be continuing to invest billions of pounds to run more frequent services and increase the capacity of London’s tube and rail network to meet the challenges of a growing London. In addition, we will be using big data to operate more effectively and to understand and predict where and when our network is busiest. Some customers have told us they would like more information to help them avoid the very busy times when they have flexibility. We are therefore using big data to calculate and communicate real-time and predicted levels of crowding across the network. This will help our customers, particularly those making journeys that are less familiar, to make more informed travel decisions and have a quicker and more comfortable journey.
This summer, for the first time, we will be releasing data to show the levels of crowding for a typical weekday on the London Underground network. This will be the first iterations of crowding data we will be releasing. In the coming years, we will continue to innovate with real-time and predictive data to increase the granularity and accuracy of our data and provide our customers the information they want and need to have the best journey experience possible.
The opportunities that arise from utilising and combining big data are constantly multiplying and evolving. By harnessing the potential of all of this data, we will be able to improve the experience of all those travelling in London.
Biography
Lauren Sager Weinstein joined TfL in 2002 where she has held a variety of roles including Senior Business Planner, Acting Head of Finance for London’s Transport Museum, Chief of Staff to the Managing Director of Finance & Planning and the Head of Oyster Development. During her time at TfL Lauren has worked on a number of projects: the establishment of TfL’s first long-term funding package for infrastructure investment; the development of the Oyster system; the launch of contactless payment card acceptance on TfL’s buses and the successful delivery of the London 2012 Olympics by providing analysis on travel patterns. Originally from Washington, DC, USA, Lauren has degrees from Princeton University and from the Harvard Kennedy School of Government.
How TfL uses ‘open data’ to help developers provide direct travel information to customers
For Eurotransport Phil Young, Head of Online at Transport for London (TfL) explains that by freely sharing transport data they can encourage the creation of new apps to make travel easier for customers and get more people working to solve London’s transport challenges.
When you think of how much data TfL has at its fingertips, our open data policy makes total sense. By openly sharing our transport data, new apps can be created that make travelling easier for our customers which in turn is helping to solve some of the transport challenges of our city.
In 2007 we began by sharing web widgets to make it clearer how our services were running. We quickly moved to sharing raw data when it became clear there was real demand from developers to create new services. In 2014 we created a unified API, which presents all the data for each form of transport (buses, tubes, trains, cycles – even river boats!) in the same format. This enables developers to write simpler code and access the same types of data across all forms of transport quickly, making development faster and easier.
Offering our data in a usable format and free-of-charge is helping to stimulate innovation in information provision. It enables developers to think creatively and test their analytical skills, while giving Londoners up-to-date information about public transport and road networks. Around 8,200 open data users are currently registered for TfL’s Unified API, from app developers to academic institutions and sat-nav providers. Almost 500 apps are now being directly powered by our open data, giving more choice and convenience for customers.
Offering open data is also cost-efficient. As part of an independent study in 2013, commissioned by the Department for Business, Innovation and Skills, Deloitte found that our open data approach saves passengers up to £58 million per annum in time against a £1 million annual investment in making the feeds reliably available. Usage has since doubled with 42% of Londoners now using apps powered by our data. We have saved money because we have not had to develop and maintain these products ourselves. We now have a thriving market in public transport apps and many new businesses and jobs created in London’s booming tech sector because of our data – all at low cost to our organisation.
However, it is not just about making our data available and seeing what happens to it. We have been actively working with a number of different organisations to experiment with our data feeds and improve them. Ahead of the 2016 London Marathon, we worked with the sat-nav manufacturer TomTom to trial a bespoke data feed covering the planned road closures for the event using DATEXII – an industry standard format for traffic event planning. We are now evaluating the trial to see how this data format could be used to bring better information to road users. We are also trying to tackle the capital’s challenges by hosting ‘Hack Days’. These events bring developers together to see how they can utilise our data to make improvements. Earlier in 2016, almost 50 developers experimented with how they could interrogate our traffic data, provided by tiny sensors that are buried in the road, to provide further data feeds.
In an age of digital innovation, the opportunities that providing free open data can present are incredibly exciting and seemingly endless.
Reference
- To find out more about TfL open data, please visit: https://tfl.gov.uk/info-for/open-data-users
Biography
Phil Young is Head of Online at Transport for London (TfL), creating the web, mobile, open data, social media and intranet products that serve 10 million customers and 27,000 staff. He leads on social media for marketing, customer services and live travel information, spanning over four million followers. Phil led the delivery of TfL’s mobile-first website, launched in March 2014, which is now used by 83% of Londoners. He has also been instrumental in the delivery of open data, releasing feeds and live APIs to a community of over 8,000 registered developers, powering over 460 apps used by millions.
Related topics
Fleet Management & Maintenance, Multimodality, Ticketing & Payments, Transport Governance & Policy
Issue
Issue 3 2016
Related organisations
Transport for London (TfL)


