Taking advantage of integrated software solutions
- Like
- Digg
- Del
- Tumblr
- VKontakte
- Buffer
- Love This
- Odnoklassniki
- Meneame
- Blogger
- Amazon
- Yahoo Mail
- Gmail
- AOL
- Newsvine
- HackerNews
- Evernote
- MySpace
- Mail.ru
- Viadeo
- Line
- Comments
- Yummly
- SMS
- Viber
- Telegram
- Subscribe
- Skype
- Facebook Messenger
- Kakao
- LiveJournal
- Yammer
- Edgar
- Fintel
- Mix
- Instapaper
- Copy Link
Posted: 19 April 2007 | Mrs. Anna Maria Monferrer, Chief of Projects Coordination of TB, Transports de Barcelona, S.A., Mr. Joaquim García, Chief of Software Developments in BUS projects, Transports d Barcelona, S.A. and Mr. Guillem Camarasa, Manager of Horta Depot, Transports de Barcelona, S.A. | No comments yet
Transport Metropolitans de Barcelona (TMB) is the second largest public transit system in Spain.
TMB operates a fleet of 1,019 buses and 631 train cars, most of them self-propelled units. This system, run by about 6,400 employees, handles approximately 550 million passengers per year. The implementation of a new integrated software solution has helped with vehicle scheduling, crew scheduling, advanced crew optimisation, rostering, and the analysis of run time measurements and passenger counting. The system’s capabilities will also help with future reporting needs.
TMB has been involved with computerisation for many years and, like many large companies, has built or purchased many independent systems to support the activities of its various departments. In the mid 80s TMB invested in a new scheduling system, HASTUS, with the primary objective of providing advanced data management and optimisation tools to the company. This system was at the time very innovative, offering the most advanced optimisers on the market and bringing excellent returns to that investment.
In the 90’s, the development of information technology solutions to support the assignment of duties to employees was seen by TMB’s management as a key requirement for our bus and metro activities. Since at this time the market did not offer technologically acceptable solutions that addressed this requirement, and since TMB had the necessary technical expertise internally, we undertook the development of our own solution.
TMB has been subject to many internal changes since the initial implementation of our in-house solution, particularly in terms of employee working conditions. These changes required significant modifications to the system which, after 10 year of operations, was showing signs of obsolescence. More specifically, the system was running on older technology (Unix, Natural), and the IT department was concerned about the eventual obsolescence of the equipment and the scarcity of expertise for the underlying software technology.
Despite the drawbacks, users were generally satisfied with the available functions as they had been built to perfectly match current process flows, so we were not keen on changing a system that had taken many years to fine-tune.
As part of our technological watch process, and in preparation for an eventual project to bring daily management tools up to par with the latest innovations, TMB’s management began to examine off-the-shelf solutions available on the market. This process illustrated that during the period since TMB decided to build its own application over a decade before, the market had developed solutions with various levels of flexibility and integrability. A sufficiently large number of qualified companies were offering systems with an excellent functional base that could be adapted within a reasonable time frame and budget. Very promising demonstrations by selected vendors convinced TMB’s management that a re-engineering of the existing system was no longer viable when compared to off-the-shelf software with many modern features that would be very costly to implement in-house.
Tender process
By the end of 2002, TMB was well advanced in preparing the tender documentation. The tender started with a pre-selection process where various candidates presented very interesting solutions, confirming to TMB that the market could provide reliable and flexible integrated solutions that also offer long term evolution and support.
A detailed analysis of the various tenders focused on integration, flexibility, functional coverage of our requirements, functionality, ability to provide non-stop service, experience with similar projects, industry leadership, and satisfaction of existing clientele. At the end of the process, the HASTUS solution proposed by GIRO was selected.
Schedule planning modules
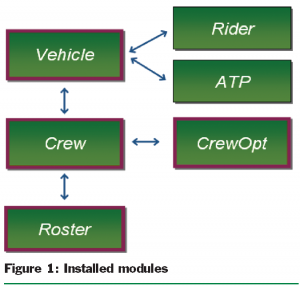
The HASTUS modules already available to TMB provided tools for vehicle scheduling, crew scheduling, advanced crew optimisation, rostering, and for the analysis of run time measurements (ATP) and passenger counts (Rider).
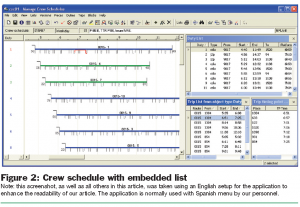
The integration of these modules is seamless, with shared functions and data tables where applicable. For instance, all vehicle scheduling functions are also available from crew scheduling contexts, and the standard time/distance diagrams used for vehicle scheduling are also used to display results of passenger count analyses. The example in Figure 2 shows another excellent example of data integration, with a display of a crew schedule configured to visualise trips in each duty, and lists shown on the right side of the graph to drill down the hierarchy of data (duties, associated trips, and for each trip, the associated list of passing times at time points).
The integration of different transportation modes in a single application is also a key feature, enabling TMB to adopt one tool for both bus and metro scheduling. This greatly simplifies the architecture of scheduling tools, allows our scheduling teams to work on different transport modes using the same application, and provides our management with much more flexibility when resources are required to plan special events or work as backups when colleagues are temporarily unavailable.
Integration of schedule planning and daily management modules
The integration of scheduling and daily management modules has had significant architectural and functional impacts on our system.
The main impact of the software on the IT architecture was the elimination of old interfaces, the integration of 3 different information systems in only one context, and the implementation of a single database to hold public transport operations data. Administrative applications like SAP are synchronised with simple interfaces, as the data models for the information that needs to be exchanged are straightforward. Many of the new interfaces required are built by TMB using configuration tools delivered with the application.
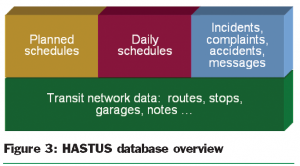
On the functional side, the introduction of the production calendar and the daily management components brought a new dimension to the management of our transportation data. Specifically, the integration with the scheduling system has eliminated data redundancy as shown in the simplified database view in Figure 3.
In this architecture, the production calendar creates an automatic link between planned and daily schedules when the planned schedules are validated and moved to production, thus eliminating interfaces and the possibility of associated errors. The application then automatically populates complementary daily tables, avoiding any data redundancy. Basic transit network and other general data elements are shared by all the modules, which means that any change done to relevant network information (ex: relocated stops) are immediately visible to all users. This greatly simplifies the maintenance of information when minor changes are requested by daily management personnel.
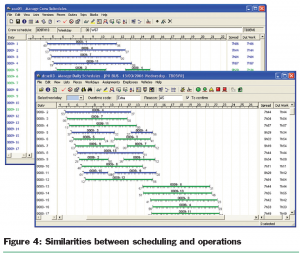
In addition, the integration provides a common user interface and a common set of application tools, thus facilitating both training and the sharing of information between our planning and operations groups. As an example, the figure in Figure 4 shows the similarity between graphical windows for crew schedule planning and daily management, although each window also provides the unique functions required to perform tasks specific to the context.
The available tools were already well mastered by our IT department, and this made it easy for us to adjust process flows during final testing as well as during the initial phasing in of the application. Today, our IT staff have developed the skills required to fine-tune our installation without vendor intervention.
Integration of daily crew and vehicle management functions
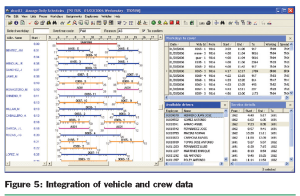
In the same way as the schedule planning modules, the daily modules integrate functions for managing employee work, vehicles, and service. This integration ensures data consistency at all times, and minimises the effort required for timekeeping operations. Visualisation of crew and vehicle data in the same windows facilitates access to underlying information and detection of potential problems. Figure 5 illustrates some of the possibilities offered, although we would probably not use such a configuration for operations. The graphical display shows both work pieces and individual trips (coloured by direction), while the associated lists show the remaining work to cover with trip-by-trip details of this work.
These highly configurable lists, which can be shown within graphical windows or as separate panes, offer many possibilities for post-operation searches and statistical analyses. Although we have not yet explored the full potential, the few queries we currently use are proving to be very powerful.
New reporting possibilities
Consolidating all our data for schedule planning, daily operations, and daily measurements in a single repository brings many new reporting possibilities, especially since the application offers multiple query tools as well as the ability to produce Crystal Reports© from within the application. Here again, our busy production schedule has not let us fully explore the potential, but we have already identified several interesting cases.
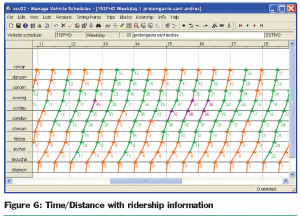
Figure 6 shows an excellent example of the integration between the vehicle scheduling and ridership analysis modules. We can display the maximum number of passengers measured for each trip segment on the time/distance diagram used for vehicle scheduling, and print this diagram in report form.
In addition, lists in all contexts can be configured to extract detailed information and produce reports for management.
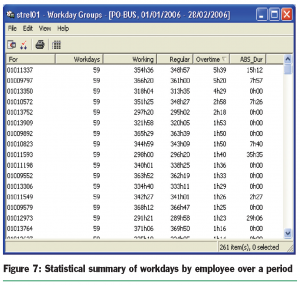
Figure 7 shows a query by employee, configured to show key data for daily assignments. We sorted the list on overtime durations to focus on employees with the most overtime.
This example shows a list with key daily statistics that can be used to support short and long term decision-making.
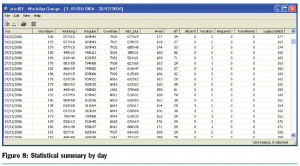
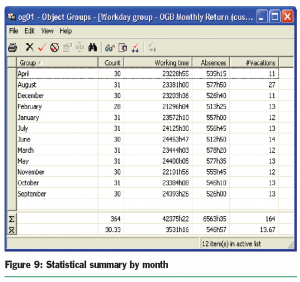
As shown in this example, more advanced queries can be used to compile weekly or monthly summaries of key performance indicators.
Many additional uses of the reporting capabilities offered by our new application were outlined during a presentation at the international HASTUS user group in Montréal. Our team is looking forward to learning how we can best exploit these capabilities to meet our current and future reporting needs.
The future
TMB continues to work in close collaboration with the vendor of the application so we can take advantage of new features that become available. Of special interest is the possibility of real-time integration with our SAP Vehicle Maintenance system. In a first step, we will likely contemplate the transfer of vehicle availability data via Web services so that vehicle assignments can be performed directly in our daily management tool.
Over a longer horizon, we are considering using the tools available in newer versions to adjust the service levels on a daily basis so as to better accommodate special circumstances. With this capability, the use of bi-directional Web services to enhance the integration with our AVL system will likely be contemplated.
Conclusions
The implementation of our new daily management system is an example of a situation where technology can become the engine of change within a company. Although the replacement of our older system brought clear benefits through the simplification of our IT architecture, the possibilities offered by the data integration it provides are far-reaching and have implications at all levels of the organisation.
At this point, we have only harnessed a fraction of what is possible by exploiting on a daily basis the advantages brought by data drill down and flexible data filtering options offered by the application. With the shake down of the system and company-wide implementation completed, we are now looking forward to further exploring the potential of this new system.









Issue
Issue 2 2007
Related organisations
GIRO
