Munich’s ridership count system
- Like
- Digg
- Del
- Tumblr
- VKontakte
- Buffer
- Love This
- Odnoklassniki
- Meneame
- Blogger
- Amazon
- Yahoo Mail
- Gmail
- AOL
- Newsvine
- HackerNews
- Evernote
- MySpace
- Mail.ru
- Viadeo
- Line
- Comments
- Yummly
- SMS
- Viber
- Telegram
- Subscribe
- Skype
- Facebook Messenger
- Kakao
- LiveJournal
- Yammer
- Edgar
- Fintel
- Mix
- Instapaper
- Copy Link
Posted: 1 April 2005 | Karin Schweiger Project Leader, Ridership Count Management Systems, Stadtwerke Munchen GmbH/MVG | No comments yet
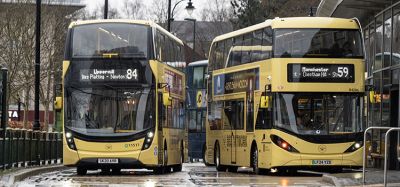
The Munich subway, tram and bus network is operated by the Münchner Verkehrsgesellschaft mbH (MVG) and has, in all, 86km of subway, 71km of tram, and 432km of bus routes for eight subway, 10 tram and 61 bus lines. Line routes and timetables in this network are not static, but are developing continuously as they must be adapted to the changing needs of the work and resident population of Munich.
Furthermore, in times of economic pressure and regarding the demands of open competition in the field of public transport, the economic success of transport systems must be more and more in the centre of planning activities.
The Munich subway, tram and bus network is operated by the Münchner Verkehrsgesellschaft mbH (MVG) and has, in all, 86km of subway, 71km of tram, and 432km of bus routes for eight subway, 10 tram and 61 bus lines. Line routes and timetables in this network are not static, but are developing continuously as they must be adapted to the changing needs of the work and resident population of Munich. Furthermore, in times of economic pressure and regarding the demands of open competition in the field of public transport, the economic success of transport systems must be more and more in the centre of planning activities.
The Munich subway, tram and bus network is operated by the Münchner Verkehrsgesellschaft mbH (MVG) and has, in all, 86km of subway, 71km of tram, and 432km of bus routes for eight subway, 10 tram and 61 bus lines. Line routes and timetables in this network are not static, but are developing continuously as they must be adapted to the changing needs of the work and resident population of Munich.
Furthermore, in times of economic pressure and regarding the demands of open competition in the field of public transport, the economic success of transport systems must be more and more in the centre of planning activities.
For these planning and controlling tasks, the transport planners for the MVG are supported by a team of market and transport researchers who collect relevant data from many sources and then process and evaluate this. A main share of this data are figures on the infrastructure that deliver spatial information on the working and living population and therefore allow to predict the traffic flow. To process and evaluate this data the transport planning software VISUM is in use at the MVG. A second pillar of transport planning and particularly for line revenue calculation is built up by ridership counts that are collected continuously. Counts are done either manually, for surveys on fixed sections or on special journeys, or they are done by automated passenger counting (APC) devices in buses and trams.
APC devices
For several years now, most of the passenger figures for the surface traffic systems are collected by APC devices in the vehicles that count boarding and alighting passengers with infrared rays. The data is collected by the automated vehicle management (AVM) system, and is stored in files, per operating day and vehicle. Each such file contains, for each vehicle equipped with a counting device, the information on time, place, boarding and alighting passengers for every stop.
Approximately 20% of the trams and buses that are in use at the MVG are equipped with APC devices – that makes 19 trams and more than 180 buses. Altogether, at the end of each day, up to 200 files with ridership figures are available from the vehicle operating system.
Until 2003, the processing and evaluation of the figures was prepared with Access Databases. Complex procedures, macros and views were applied to process the data journey for journey, and to finally join it in one single table. This table built the basis for all the evaluations and reports run by the researchers for planning and controlling purposes. With the rising number of APC devices in use, the effort to process all the data properly also grew over the years. Furthermore, it became more and more difficult to handle the amount of data and to run reliable evaluations. Changes in timetables and line routes hindered the aggregation of data over a longer period of time – there was no link between the ridership figures and the timetable data from the operational planning system.
Ridership count management system development
To improve this situation, the decision was taken to implement an integrated ridership count management system (RCMS), with the following objectives:
- To merge all the planning data in one database, especially timetable data and passenger figures
- To survey, optimise and automate the dataflow of ridership data, especially that from APC devices
- To build up a better basis for evaluations
- To make evaluations and reports accessible for the planners, up-to-date at any time, easy to handle and understand
In 2003, conception and development of the RCMS began. PTV AG suggested constructing an integrated system, with the VISUM data model in the centre. Because the VISUM software was already in use at MVG, the decision was taken in favour of this model in expectation of synergetic advantages not only for the new application, but also for transport planning and simulations.
The development of the RCMS was executed in several steps and in close cooperation with all the parties at the MVG involved in the whole process. As a first step, the concept and system architecture of the RCMS was drawn up in several workshops. From July 2003 onwards, the actual development took place. Step by step, the single components of the application were installed as prototypes at the MVG, and thus could be tested and optimised at the stage of development. In December 2003, the system went live, and in March 2004 the final tests were conducted and the acceptance of the complete system could be achieved.
System architecture of the RCMS
The core of the application is an SQL-Server database. Data from the timetable planning software is held there as well as ridership figures from several sources. Around this database a workflow was built up consisting of several software modules. These modules support and bring together all the processes needed for the collection and evaluation of data.
Timetable data
For the timetable data, the data model of the transport planning software VISUM9 was applied. This data model contains all of the information on a transport network, beginning with the location of stops, via line routes and time profiles to single vehicle journeys, line blocks and operators. As an operational planning system, the software Interplan is in use at the MVG. An interface from Interplan to VISUM was implemented, and with every substantial change of timetables the current data is exported from Interplan and imported into the VISUM data model of the RCMS.
As already mentioned, a transport system, as complex as that in Munich, requires permanent adaptation to keep with the change in demand, either from the traffic situation or from operational concerns. This means, for the RCMS, that several versions of the complete timetable data must be held in the database to cover a longer period of time – it has proven practical to import the complete data every three months.
Import and processing of ridership data
For the RCMS application, the VISUM9 data model was expanded to include the structure of ridership data. This data is closely related to the timetable data; for every journey with ridership figures there must be an equivalent in the timetable data from the operational planning system.
All possible kinds of ridership figures can be imported into the RCMS application. There are section counts on the subway lines, manual surveys on special vehicle journeys and, of course, the journeys that have been recorded by the APC devices. For the different count types specific import formats have been defined, so that the count data can be imported automatically into the application’s database. The data from the APC devices are imported via batch job every night, data from special surveys can be read at any time, initiated by the system administrator.
All the count data that has been collected for complete vehicle journeys, in contrast to section counts, are further processed after the import. Firstly, the data is compared to the currently valid timetable data, to ensure consistency. If for a journey no equivalent can be found in the timetable data, the figures of this journey are dismissed from the application and cannot be used for reports. This can be the case when there are sudden changes in the line routes or timetables – due to street works or big events.
Secondly, the data is balanced concerning the number of passengers boarding and alighting during a journey. This has become necessary because the APC devices do not have 100% precision. An algorithm was developed to balance the number of passengers over the whole journey. Nevertheless, if the difference exceeds a defined limit, the data for this whole journey is dismissed too.
Data that has successfully passed these two steps is then aggregated on two time levels. The first level is that of the survey period. A survey period is defined by the application administrator and, in most cases, is related to a calendar month, but substantial changes in the timetables are taken into account. Timetable periods are the second level of aggregation – they are determined by the validity of a version of timetable data, imported into the RCMS application. On these two levels, the data is aggregated journey by journey, and further calculations are carried out and their results stored in the database, in preparation for the reports.
For every line route and every aggregation level, peak periods are computed and stored in the database. At the end of a survey or timetable period, the values for journeys, that do not have valid ridership data due to any of the reasons mentioned above, are interpolated from the values of comparable journeys. Thus, after a survey or timetable period has been completed, there is ridership data for every journey of the timetable data. With these aggregated and pre-calculated data, reports can be run quickly and efficiently and are available for planners and decision makers at any time.
Survey planner
To get the maximum coverage of all the journeys with the given equipment of counting devices, a survey planner was implemented as another software module of the RCMS. The module generates a survey plan for a given period of time on the basis of the currently valid timetable data. The survey planner does, of course, also take into account the different timetables valid at different operating days like school days and holidays.
The MVG has an ambitious aim to have 100% coverage of all the journeys, for every survey period on the most frequent operating day type – Monday to Thursday during school. That means that during a survey period, every vehicle journey from the timetable shall be recorded by the APC devices at least once. With the given rate of 20% of the vehicles equipped with counting devices, this is possible for survey periods of one calendar month, even when the dismissed data is taken into consideration.
For less frequent operating day types like holidays or weekends, this coverage is certainly not possible, and more journeys must be interpolated for these days at the end of a survey period. But on the aggregation level of timetable periods (duration approximately three months) there is a satisfactory coverage of ridership data for every operating day type.
Reports
Up-to-date and easily accessible reports have been defined as one of the main objectives of the RCMS. For that, the VISUM Information Server (VIS) was integrated into the application. The VIS is a web publishing application that allows an unlimited number of users to run pre-defined reports on the database via the Internet browser. By implementing a user access control system special reports can be generated and supplied for different user groups.
All of the reports currently available in the VIS for planners and decision makers are based on the data structure for ridership data described above. They can be run on both aggregation levels (survey or timetable period), so most reports are, by choice, on the basis of one month or one quarter of a year. Additional reports can be run for a specific operating day type that the user can select.
Standard reports allow the user to generate diagrammatic or tabular evaluations of the following figures, for all possible temporal and spatial parameters:
- Passengers boarding or alighting
- Absolute or relative load of the vehicle between two stops
- Passenger kilometers
With the peak period calculations that are stored in the database it is furthermore easily possible to calculate the load of a line at the peak section during the peak hour; these values are especially relevant for timetabling and vehicle scheduling.
Other common reports available via the VIS are:
- Time profile (e.g. for the whole operating day type) on the absolute load for a line at a certain section
- Time profile of a selected vehicle journey over the complete line route, with passengers boarding, alighting and load in the vehicle
- Time space diagram for a line, covering the whole operating day type and the whole line route
In addition, the standard reports offer the possibility to aggregate the data on different levels, e.g. line or operating day type. This way, daily or weekly figures for lines and sections can be obtained from the system within seconds, by any user, without special database knowledge.
In addition to the standard reports, ad-hoc queries can be run directly against the database for special questions. Timetable and infrastructure data can, for example, be evaluated for marketing campaigns. Another functionality of the VIS is the integration of the VISUM software via COM interfaces, and in the representation of evaluation results as network diagrams. At the moment, the transport researchers at the MVG are migrating their VISUM model to the latest release VISUM9. Only when this task has been completed can all the functionality of the VIS and network diagrams be available.
As a supplement to the standard reports, the research team creates two comprehensive reports, where ridership and timetable data are evaluated together, and that give planners and decision makers a quarterly overview of the performance of the transport systems and lines. One of these reports also takes into account the ‘Nahverkehrsplan’ – a body of regulations set up by the City Council of Munich on public transport.
Additional features of the RCMS
In addition to the described main features more modules have been implemented in the RCMS application to support the whole process of the ridership data flow. All of these modules are accessed via the administration pages of the VIS:
- Administration of all modules; this includes process control as well as the configuration of parameters, e.g. the aspired quota of counted journeys per operating day type for the survey planner.
- Archiving of timetable and ridership data for periods that are no longer relevant for planning and evaluation, and the possibility to re-archive this data.
- Quality management for ridership data: when importing and processing the data from the APC devices, detailed log files are written concerning the dismissed data. Thus, leaks and problems in the data flow can be discovered and the building of a solid database is actively supported by this QM process.
Status quo and outlook
The RCMS application has now been in operation since December 2003. Besides the technical implementation, the biggest challenge was – and continues to be – the integration of data from different departments within the organisation, as this includes infrastructure, timetable and operation data. The effort already proves successful and beneficial for other projects and systems.
Apart from the reporting described above, there are considerations to use the ridership data from the APC devices for the revenue distribution process in the Munich Transport and Tariff Association. For data to be used in such a process there are strict requirements concerning the precision of the counting devices and the statistical significance of evaluations. To meet these requirements, measures are established within MVG to survey the whole process of gathering, reading and evaluating the data and, especially, to improve the accuracy of the counting devices. Many of the RCMS features are highly supportive for this task.
Furthermore, ridership counts will be used to calibrate the transport model that is being built up for VISUM9 at the moment.
So, the integration of planning software and survey data is continuing, and with the RCMS not only an application for controlling and evaluating passenger figures was implemented, but also the layer for a solid database for the whole process of transport planning was built.


Related topics
Travel & Passenger Information
Issue
Issue 1 2005